
How to Check Linux Server Logs and Troubleshoot Errors
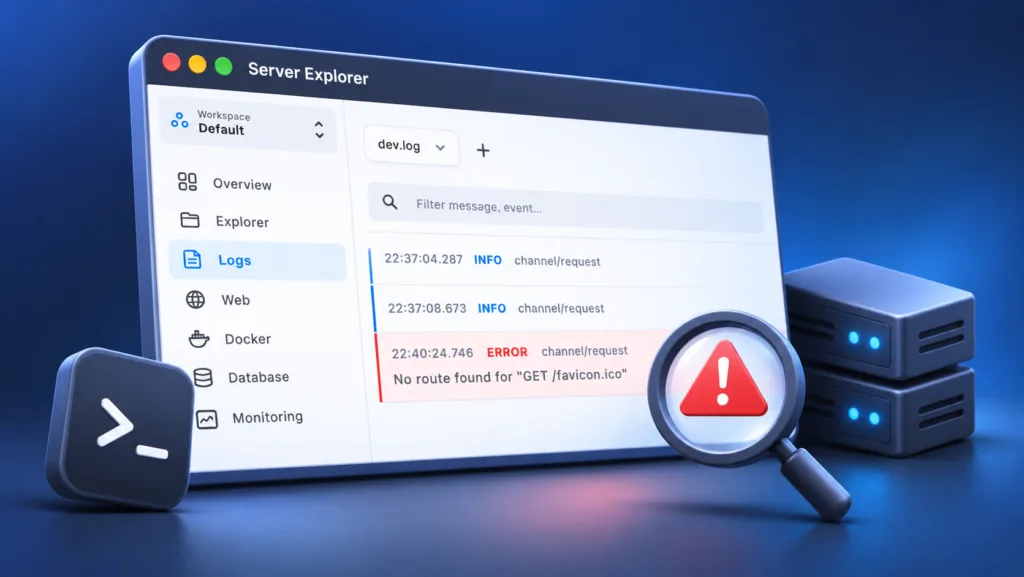
Your app was working yesterday. Today, the website returns a 500 error, the API stops responding, or a service refuses to start. Before restarting everything, check your Linux server logs. They often tell you what failed and when.
Here are the commands worth knowing, plus a visual way to investigate your VPS with Server Explorer.
1. Where Are Linux Server Logs Stored?
Linux doesn’t keep every log in one file. The location depends on the service and how it runs:
- systemd services: the system journal, accessed with
journalctl. - Traditional log files: commonly under
/var/log/(for example,/var/log/syslogon some distributions or/var/log/messageson others). - Web servers: often
/var/log/nginx/error.logor/var/log/apache2/error.log, depending on configuration. - Docker containers: view output with
docker logswhen the container uses a compatible logging driver. - PM2 applications: use
pm2 logsfor managed Node.js processes.
Start with the service that is actually failing. Don’t search every log on the server at once.
2. Check Service Logs with journalctl
If your application runs as a systemd service, first check its status:
sudo systemctl status myapp.serviceThen read the most recent messages:
sudo journalctl -u myapp.service -n 100 --no-pagerTo watch new messages as they arrive:
sudo journalctl -u myapp.service -fTo narrow the investigation to recent events:
sudo journalctl -u myapp.service --since "1 hour ago"Replace myapp.service with your actual unit name. If a service won’t start, look for messages about missing files, invalid configuration, permissions, or failed dependencies.
Tip: journalctl -p err -b shows error-priority messages from the current boot, but it can omit useful warnings and context. Read the surrounding lines before deciding what caused the failure.
3. Read Log Files with tail and grep
Some applications and web servers write to files instead of, or in addition to, the journal.
For example, to inspect recent Nginx errors:
sudo tail -n 100 /var/log/nginx/error.logTo follow new entries:
sudo tail -f /var/log/nginx/error.logTo search for errors in a particular file:
sudo grep -in "error" /path/to/app.log | tail -n 30grep matches text, not necessarily the severity of an event. An application may log failures as exception, fatal, timeout, or another term. Also check timestamps so you don’t mistake an old error for today’s incident.
4. Check Docker and PM2 Application Logs
If your application runs inside Docker, start by identifying its container:
docker ps -aThen inspect its recent output:
docker logs --tail 100 my-containerFollow new messages with:
docker logs -f my-containerFor a Node.js app managed by PM2:
pm2 list
pm2 logs my-app --lines 100
These commands are especially useful when an app exits immediately after starting. If a Docker container keeps restarting, see our related guide: Docker Container Keeps Restarting? 5 Things to Check.
5. Check Linux Server Logs with Server Explorer
You don’t have to manage every investigation across separate terminal windows. Server Explorer is a desktop SSH client for working with remote Linux servers through a visual interface.
Bring your servers into focus.
A desktop app for macOS and Windows. Connect over SSH.
Once connected to your VPS, you can use its Logs section to inspect supported log sources and its integrated Terminal to run commands such as journalctl, tail, or docker logs when needed. The available log sources depend on the application version and your server configuration.
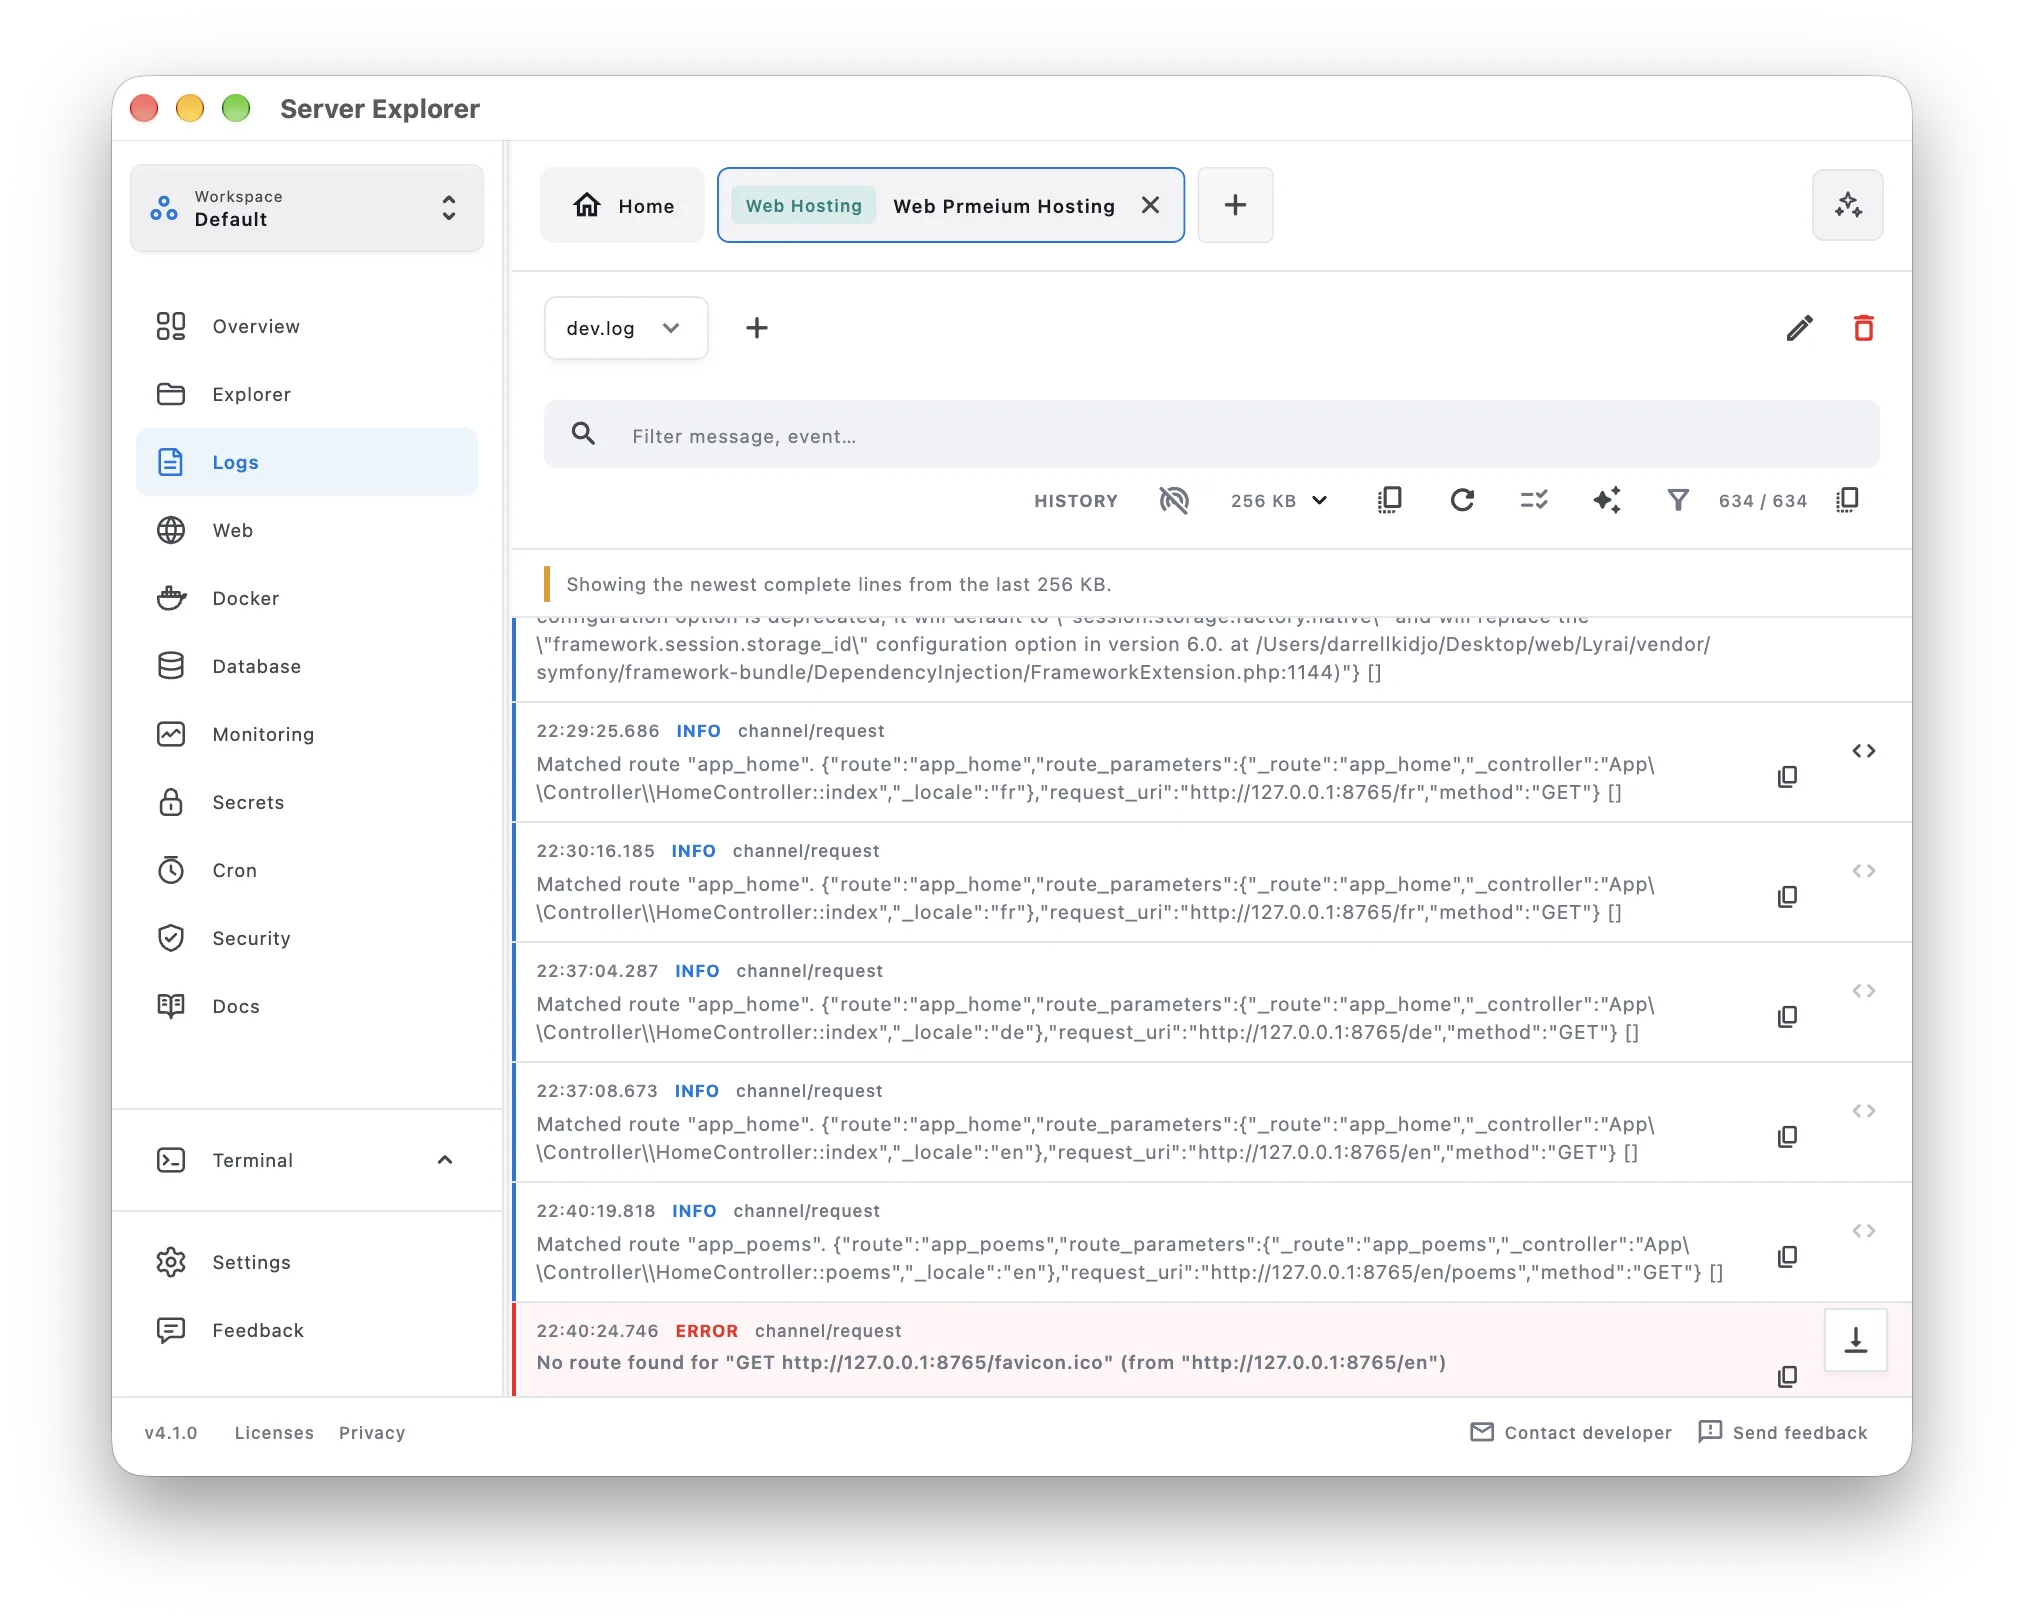
For example, if Nginx stops serving your application, open the relevant log source if available, or use the built-in terminal:
sudo journalctl -u nginx -n 100 --no-pager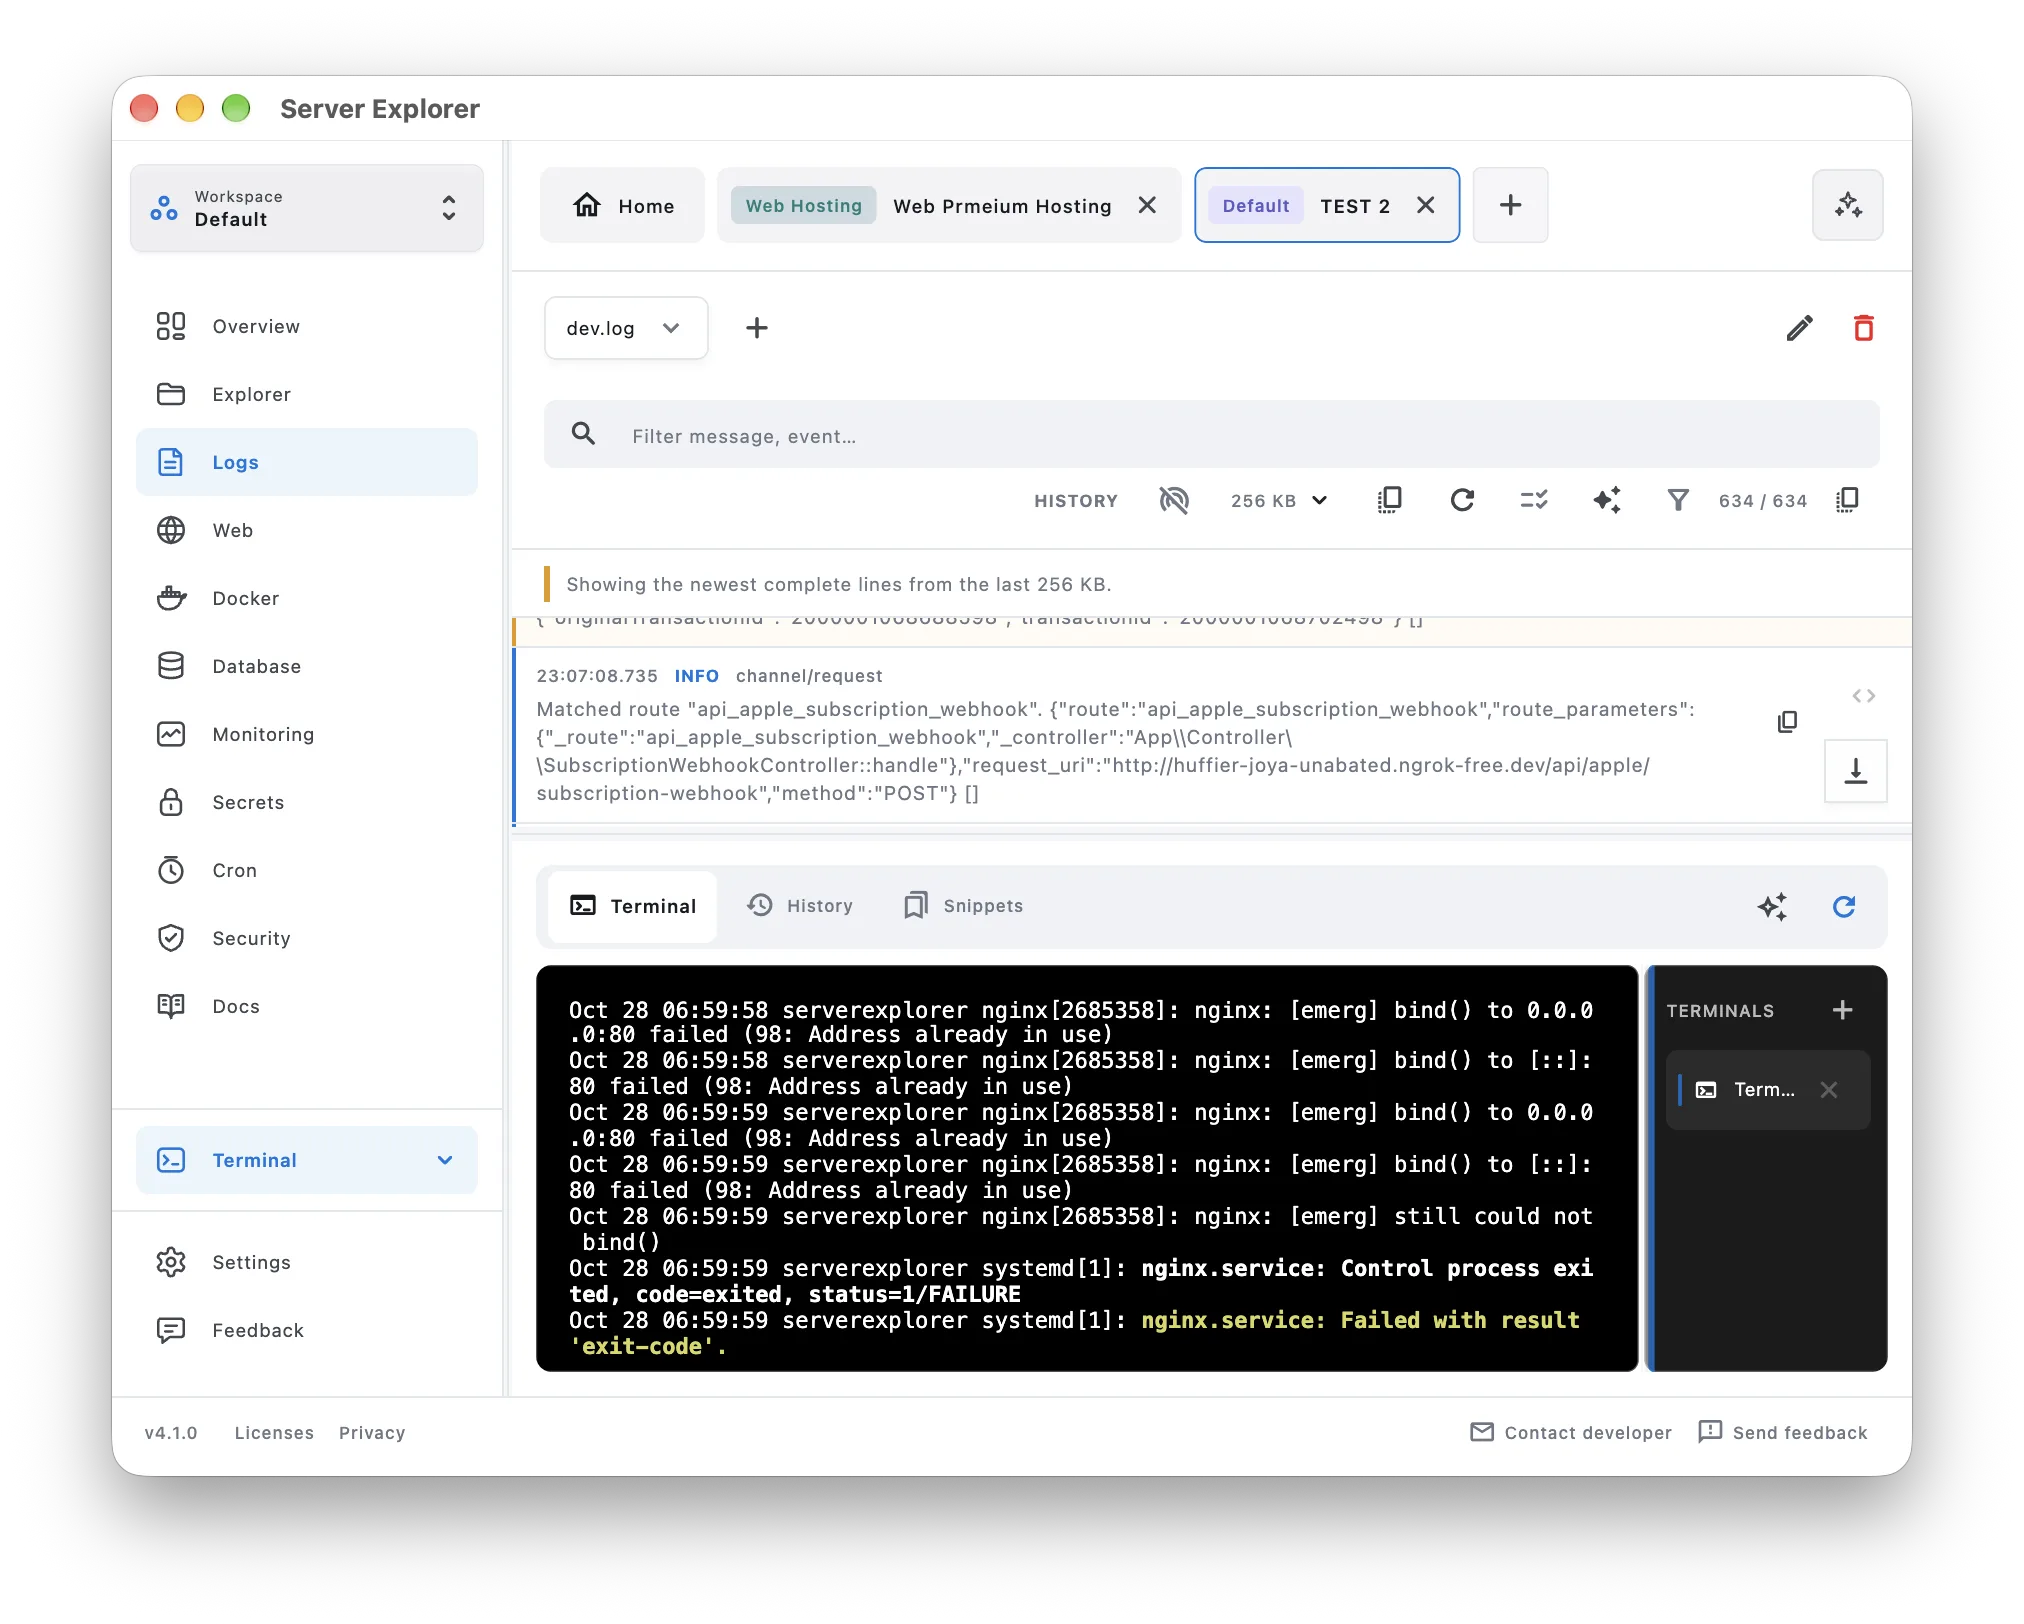
This keeps server navigation and troubleshooting in one place without claiming to replace Linux’s native diagnostic tools.
Bring your servers into focus.
A desktop app for macOS and Windows. Connect over SSH.
6. A Simple Checklist When Your App Goes Down
- Identify the failing component: web server, app process, database, or container.
- Check its status:
systemctl status,docker ps -a, orpm2 list. - Read recent logs: filter by service and time instead of scanning everything.
- Find the first relevant failure: the last error isn’t always the root cause.
- Fix the cause, then verify: confirm the service stays healthy and new errors stop appearing.
Be careful when sharing logs: they can contain access tokens, private URLs, personal data, or credentials.
Final Thoughts
When a Linux application fails, logs are usually the fastest place to start. Use journalctl for systemd services, tail for log files, and docker logs or pm2 logs for applications running under those tools.
If you manage several VPS instances, Server Explorer gives you a visual workspace for navigating servers and investigating issues without juggling as many separate windows.
Bring your servers into focus.
A desktop app for macOS and Windows. Connect over SSH.